AI Chat
Found in: Performance > AI ChatAI Chat provides an interactive chatbot for querying your data, generating reports, and creating dashboards using natural language.
AI features require the AI & Analytics Package subscription and are currently available to Super Admin users.
Interface Overview
The page offers a familiar chat-style interface. Type your question, and the assistant replies in real time.
Configuration Options
- Preserve chat history: When enabled, the full conversation history is passed to the AI instead of just the last message. This provides more context but can increase usage costs. Leave this on when refining a line of questioning. Turn it off for one-off queries.
- Model selection: Choose the model that fits your needs. Use a faster, lower-cost model for simpler questions. Switch to a more advanced one when deep data analysis is required.
AI Inputs for Chat
Administrators can configure AI Inputs in Chat Mode to provide predefined prompt templates. These appear as selectable options next to the send button:

The blue button shows how many inputs are currently selected. Click it to open the dropdown and select which prompts to include with your message.
Combining Multiple Prompts
You can select multiple AI inputs simultaneously to fine-tune the AI’s responses. Each selected input adds its predefined prompt as context—similar to how Projects work in ChatGPT, these function as system prompts that guide the AI’s behavior.
Best Practice
Create dedicated AI inputs for prompts you use frequently. For example, you might have separate inputs for “Focus on compliance data,” “Include cost analysis,” or “Format as executive summary.” Combining these gives you precise control over the AI’s output without retyping instructions each time.
Common Use Cases
AI Chat supports a wide range of tasks. Here are five common ways to leverage it:
| Use Case | Example Query |
|---|---|
| Data Questions | Top 10 clients by booking man days sum in 2025 |
| Charts & Graphs | Inspection results in 2025, pie chart |
| Compliance Search | Requirements for electric scooters (searches CELEX database) |
| Safety Issues Search | Potential issues for drinking paper straws (searches RAPEX database) |
| Notifications | Notify me when there are more than 5 unpaid invoices overdue by 30+ days |
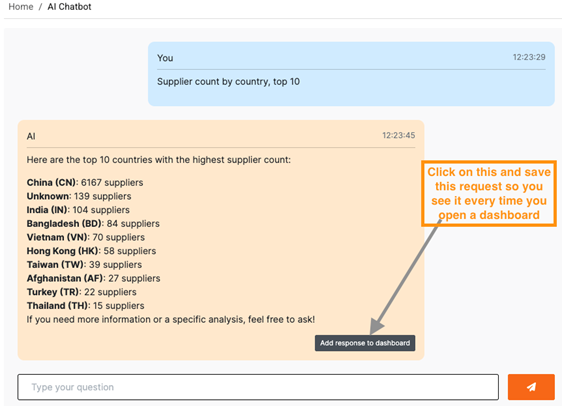
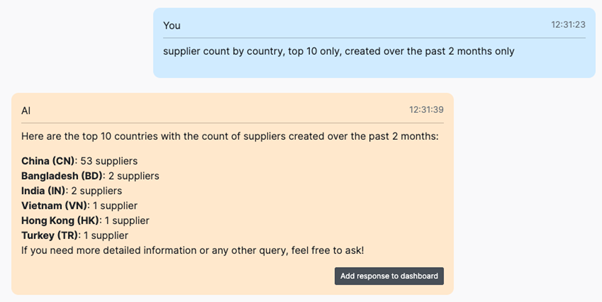
Data Questions
Ask questions about your business data in natural language. The AI has access to your live database and can query, aggregate, and analyze information across all your records.
Example queries:
Top 10 clients by booking man days sum in 2025How many inspections were completed last month?List all suppliers with overdue certificationsWhat is the average time from booking creation to completion?Show me all bookings without assigned inspectors
The AI understands relationships between your data entities. You can ask complex questions that span multiple tables—for example, asking about clients based on their booking history or suppliers based on inspection results.
Once you have a useful result, you can add it to a dashboard for ongoing monitoring.
Query Writing Tips
Today’s AI models are powerful—but not perfect. Think critically and review results carefully. Use exact field names from Syncontrol when possible. While the AI might sometimes guess your meaning correctly, being specific helps get better results.
Example of a well-written request:
“List the acronyms of the clients associated with bookings that haven’t been invoiced yet and that are over 4 man-days in aggregate, that have a current step greater than 1, and that have a start date in the past. Include the client acronym, comma-separated booking UUIDs and URLs to each booking, and the count of uninvoiced bookings, sorted by count.”
Example of a query that may be misunderstood:
- Say you have a “qualified” property on suppliers, with values like “yes”, “no”, or blank.
- If you ask for “unqualified suppliers,” the AI might interpret this as “suppliers with a blank value.”
- A better query: “Include count of unqualified suppliers. An unqualified supplier is one where the qualified column is ‘no’.”
Tip
Be specific with date ranges, field names, and conditions. The more precise your query, the more accurate the results.
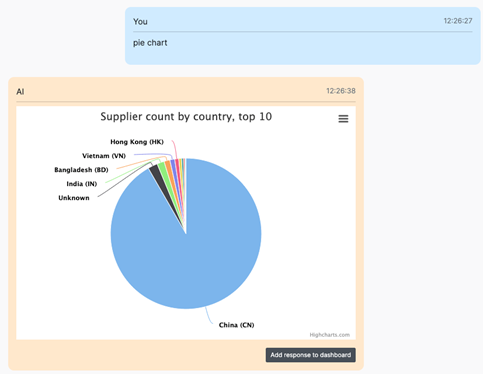
Charts & Graphs
Request visualizations by specifying what data you want and what chart type to use. The AI generates interactive charts that you can add directly to dashboards.
Example queries:
Inspection results in 2025, pie chartMonthly booking count for the last 12 months, bar chartTrend of defects found per quarter, line chartSupplier distribution by country, pie chartCompare man-days by service type this year vs last year
If you don’t specify a chart type, the AI will choose one that fits the data. For more control, explicitly request the type you need:
Supported chart types: pie chart, bar chart, line chart, area chart, or table.
Once you’re happy with a visualization, you can add it to a dashboard for ongoing access.
Compliance Search (CELEX Database)
Search the CELEX database for EU regulatory requirements relevant to your products or services. This helps ensure compliance with applicable standards and directives.
Example queries:
Requirements for electric scootersCE marking requirements for medical devicesEU regulations for children's toys safetyWhat are the REACH requirements for textiles?Labeling requirements for food products sold in EU
The AI searches official EU legislation and returns relevant directives, regulations, and standards. Results include document references you can use for further research.
Safety Issues Search (RAPEX Database)
Search the RAPEX (Rapid Alert System for dangerous non-food products) database to identify potential safety issues, recalls, and alerts related to specific product types.
Example queries:
Potential issues for drinking paper strawsRecent recalls for lithium batteriesSafety alerts for power banksKnown issues with children's clothing drawstringsRAPEX alerts for cosmetic products this year
This is valuable for risk assessment, supplier evaluation, and proactive quality management. Understanding common issues in your product category helps you focus inspections on high-risk areas.
Creating Notifications
Set up automated alerts that monitor your data and notify you when specific conditions are met. The AI creates these as active automations that run continuously.
Example queries:
Notify me when there are more than 5 unpaid invoices overdue by 30+ daysAlert me when any open issue is created with priority = highNotify when a new defect is reported classified as criticalNotify me of new bookings created that are still unconfirmed after 24 hoursNotify me daily at 10am about number of bookings created yesterday with sum of man-days
Notifications can be condition-based (triggered when data matches criteria) or scheduled (sent at specific times with summary information).
Managing notifications:
-
List my notifications— Review all active notifications -
Delete notification #5— Remove by number -
Delete booking notification— Remove by description -
Pause notification #3— Temporarily disable -
Update notification #2 to check weekly instead of daily— Modify schedule
Adding Results to Dashboards
Once you’re satisfied with a response—whether it’s a data table or a chart—you can add it to a dashboard using the “Add to Dashboard” button:
How dashboard items work:
When you add a result to a dashboard, the system saves your original query. The dashboard then re-executes this query automatically to fetch the latest data, refreshing at most once per hour. This means your dashboard always shows current information without manual updates.
Example
Suppose you ask: “Show me bookings created this week with status pending, as a table.” Adding this to your dashboard creates a live widget that updates with the latest pending bookings. Each time you view the dashboard, you see fresh data—not a static snapshot from when you first asked the question.
This is especially useful for:
- Daily metrics — Track booking counts, inspection totals, or revenue figures that change frequently
- Status overviews — Monitor pending approvals, overdue tasks, or open issues
- Trend charts — Watch how key metrics evolve over time with line or bar charts that auto-update
Both text/table results and visualizations can be added to dashboards the same way.
Data Privacy & Security
Your data remains confidential. We allow the AI engine to read your database to generate replies, but your data is not used to train models.
Source: How We Use Your Data
We may support additional language models in the future, but data privacy will always remain a top priority.